Monitoring
E-FARM: The monitoring phase is the core of the efficiency project
E-FARM: the monitoring platform that allows real-time access to power quality devices for the control of electrical parameters, performance verification, and reporting of the results achieved. The platform includes 3 monitoring applications: · Monitoring of EP-X · Monitoring of PQ-LINE · Monitoring of Aladin
The 3 steps of a power quality project for plant optimization
-
1
Diagnosis
Data collection and analysis
-
2
Implementation
Application of power quality devices according to the project
-
3
Monitoring
Verification and reporting of results
E-Farm
E-FARM is the monitoring platform that allows real-time access to power quality devices for the control of electrical parameters, performance verification, and reporting of the results achieved. The platform contains 3 monitoring applications:
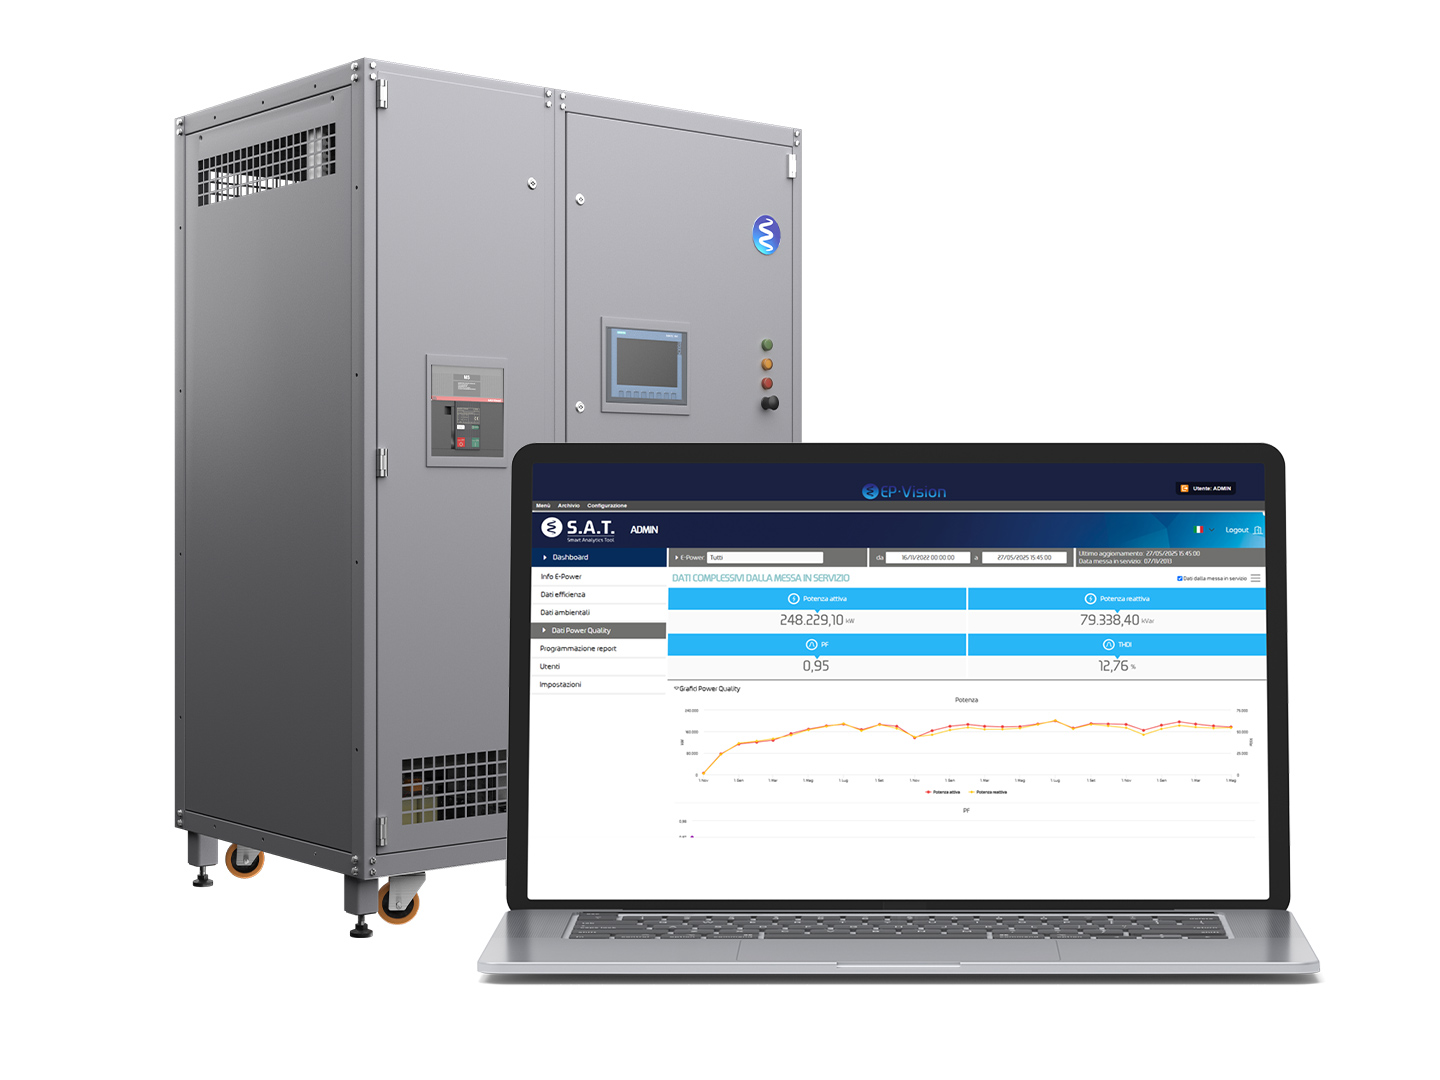
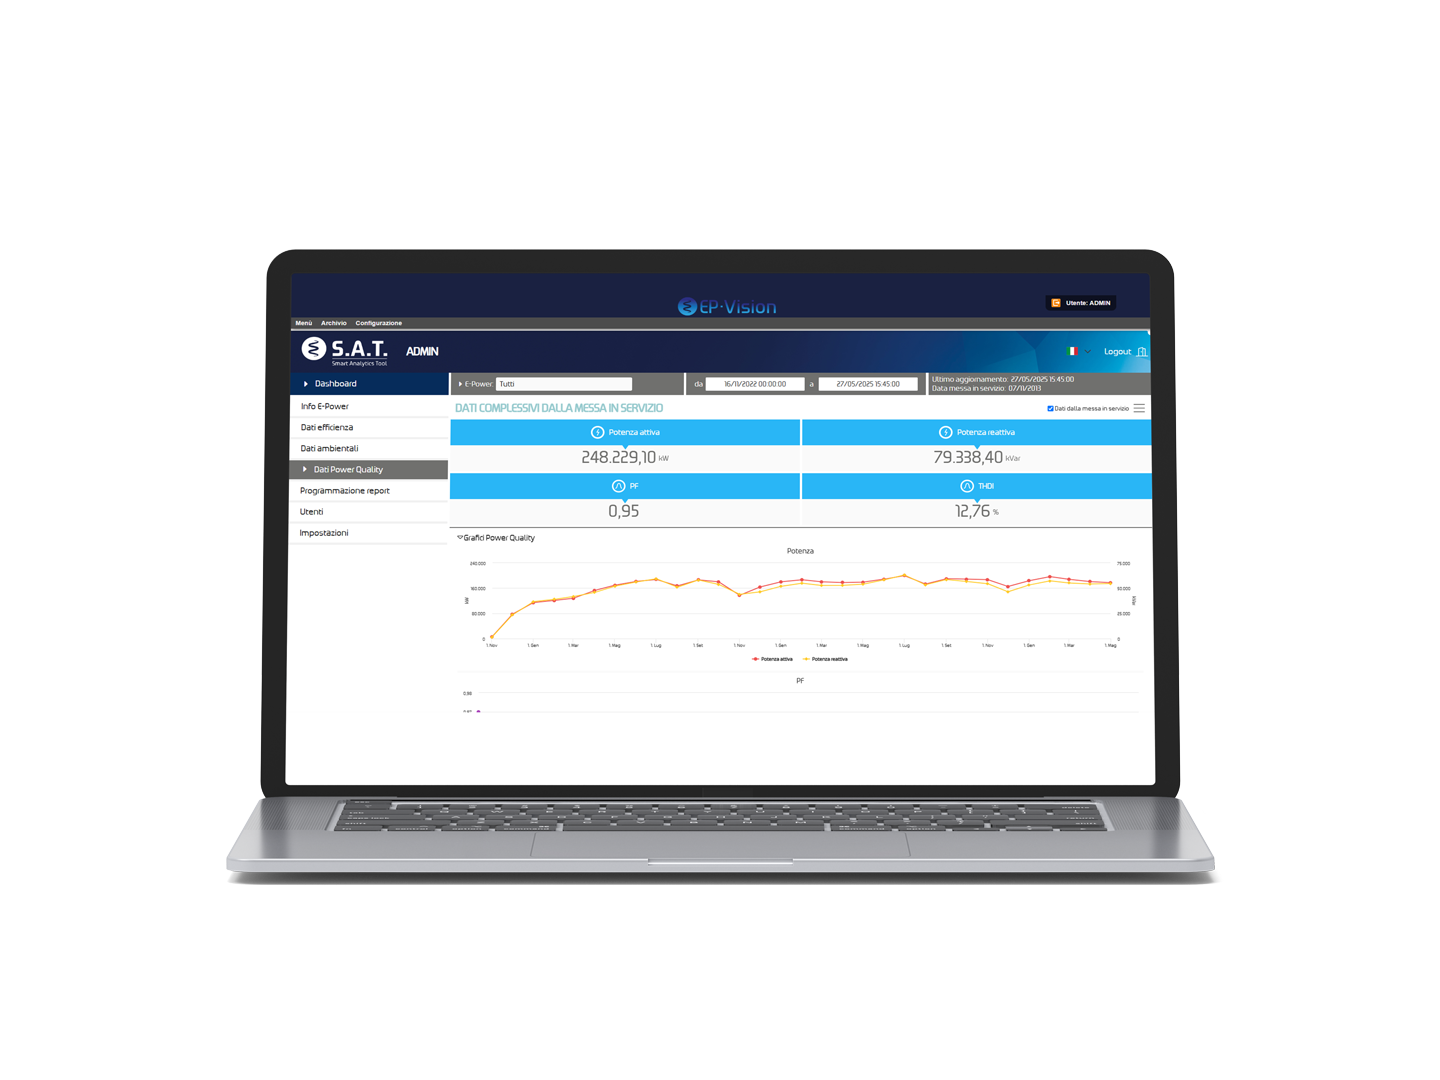
EP-X
Monitoring of EP-X
Allows you to immediately check the performance of the EP-X system, both in terms of energy efficiency and environmental impact, in absolute values and charts. It also enables monitoring of all the main electrical parameters on the line managed by EP-X and aggregates data to report the results achieved in energy, economic, and environmental terms.
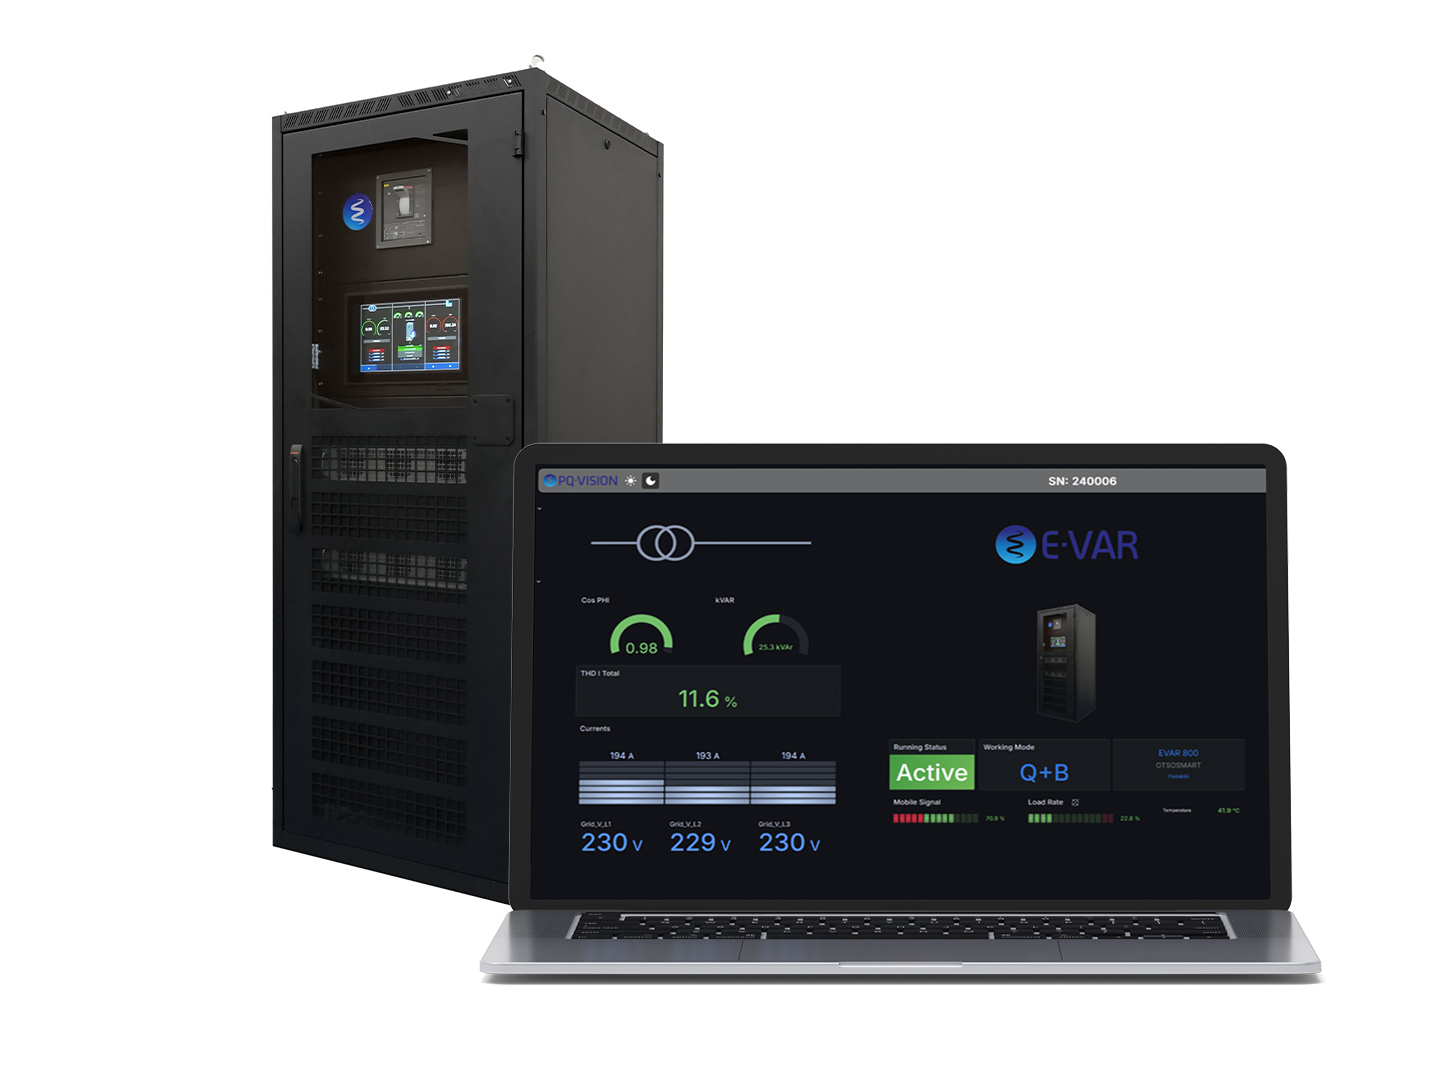
PQ-LINE
Monitoring of PQ-LINE
All the functions and performance of the PQ-LINE devices can be monitored either via HMI (touchscreen) or remotely through the application, which guarantees simple and immediate control of all Power Quality parameters managed by the device.
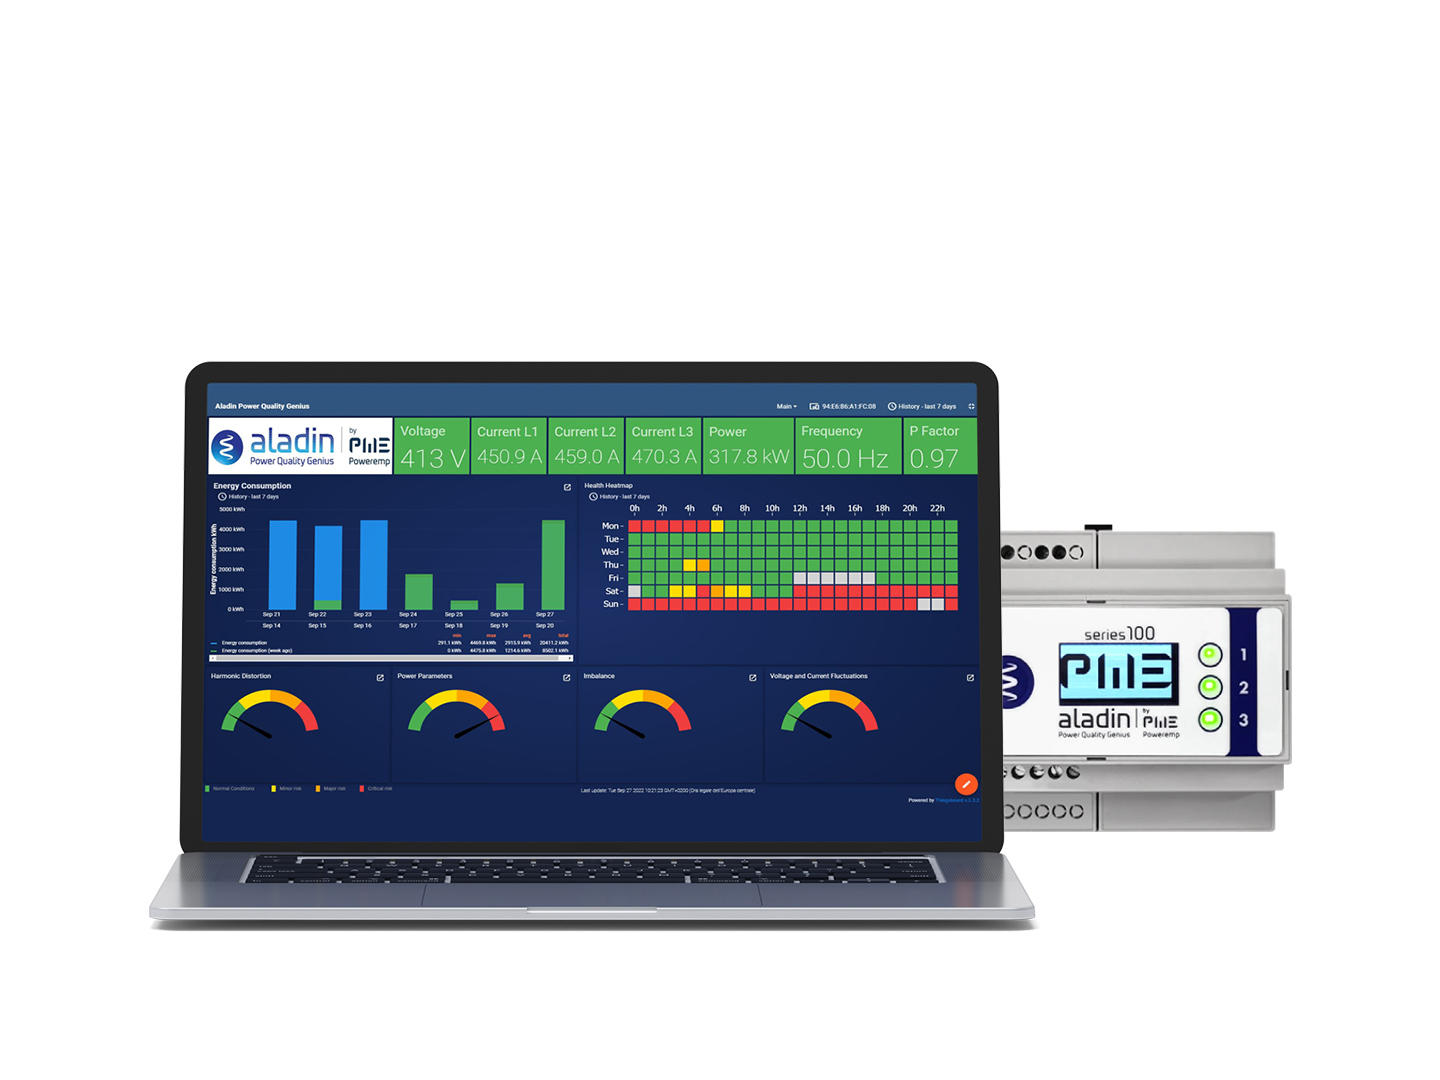
Aladin view
Monitoring of Aladin
The View application allows visualization and storage of acquired power quality data, intuitive monitoring of the plant's health status hour by hour, mapping of critical events (transients) and regulatory limit exceedances, and generation of weekly reports for the energy balance and plant health status.
EP-X monitoring
checks EP-X performance
Iimmediate verification of the EP-X system’s performance, both in terms of energy efficiency and environmental impact, in absolute values and charts. It also enables monitoring of all the main electrical parameters on the line managed by EP-X, as well as data aggregation and reporting of the results achieved in energy, economic, and environmental terms.
EP-X MONITORING
Which allows you to:
-
Immediately verify the EP-X system’s performance,
both in terms of energy efficiency and environmental impact, in absolute values and charts
-
Receive automatic periodic updates
on all data and establish an effective interactive channel with Energia Europa
-
Monitor all main electrical parameters on the line managed by EP-X,
detected with high-frequency sampling, and download data of interest for selected time intervals
-
Aggregate data and report results achieved
in energy, economic, and environmental terms
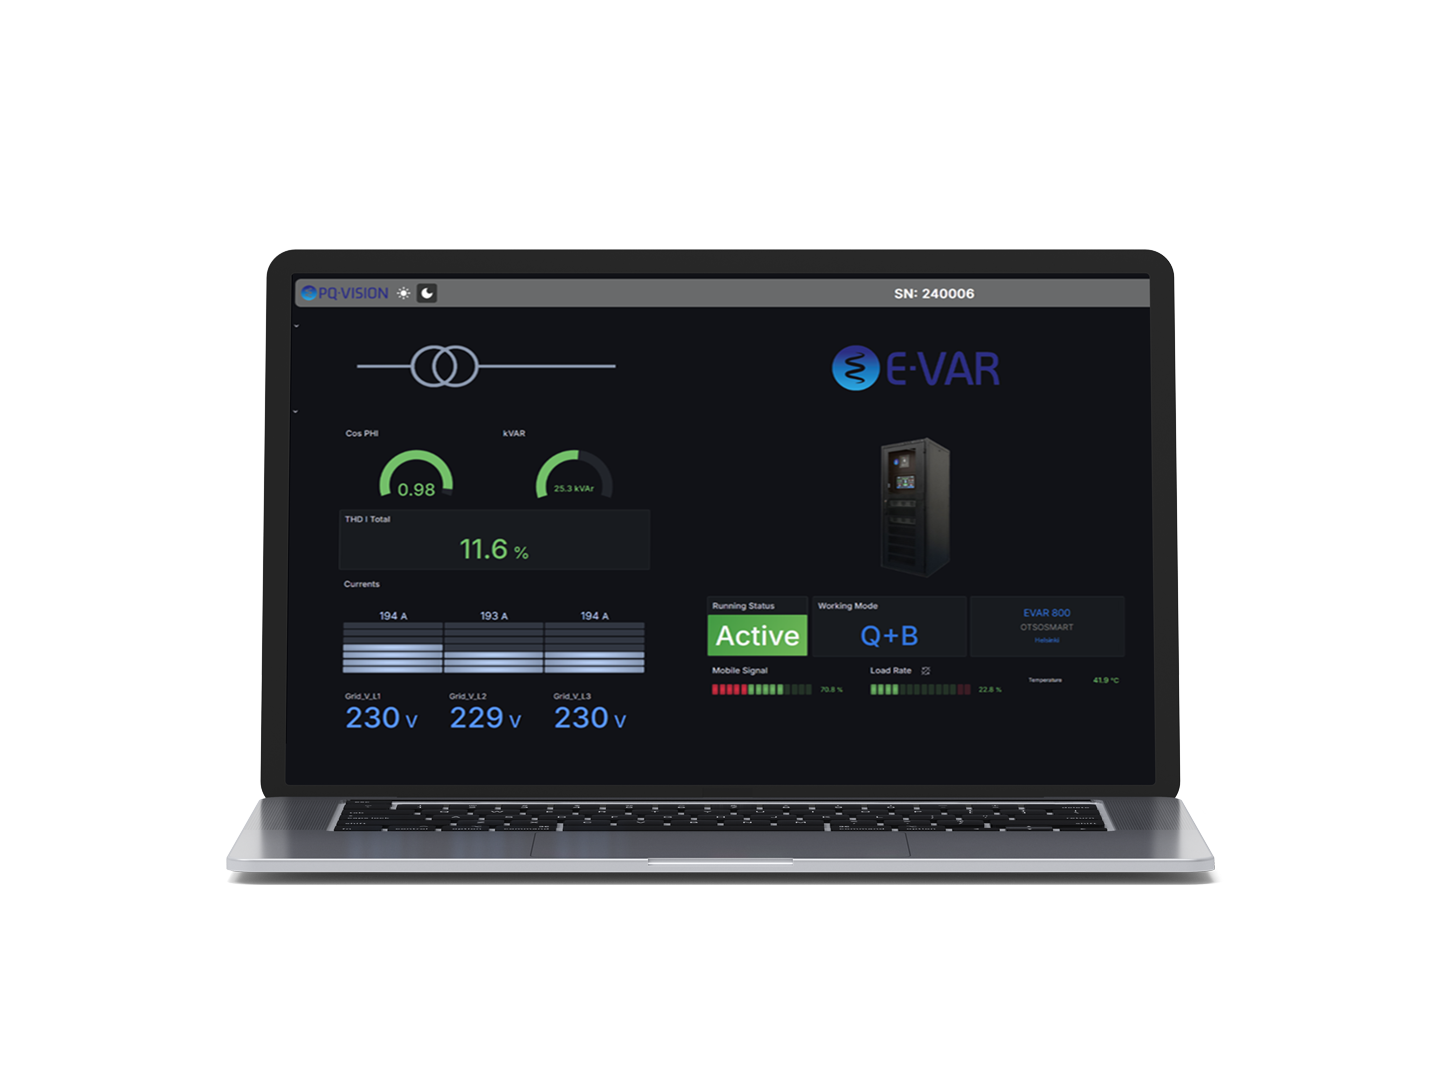
PQ:LNE monitoring
monitors the performance of PQ-VAR, PQ-PRO and PQ-MAX
All the functions and performance of the PQ-LINE devices can be monitored either via HMI (touchscreen) or remotely through the application, which guarantees simple and immediate control of all Power Quality parameters managed by the device.
PQ-LINE monitoring
All the functions and performance of the PQ-LINE devices can be monitored either via HMI (touchscreen) or remotely through the application, which guarantees simple and immediate control of all Power Quality parameters managed by the device.
-
Inductive and capacitive reactive power
-
Phase balancing
-
THDI improvement and harmonic reduction from 2nd to 13th (in the PRO version)
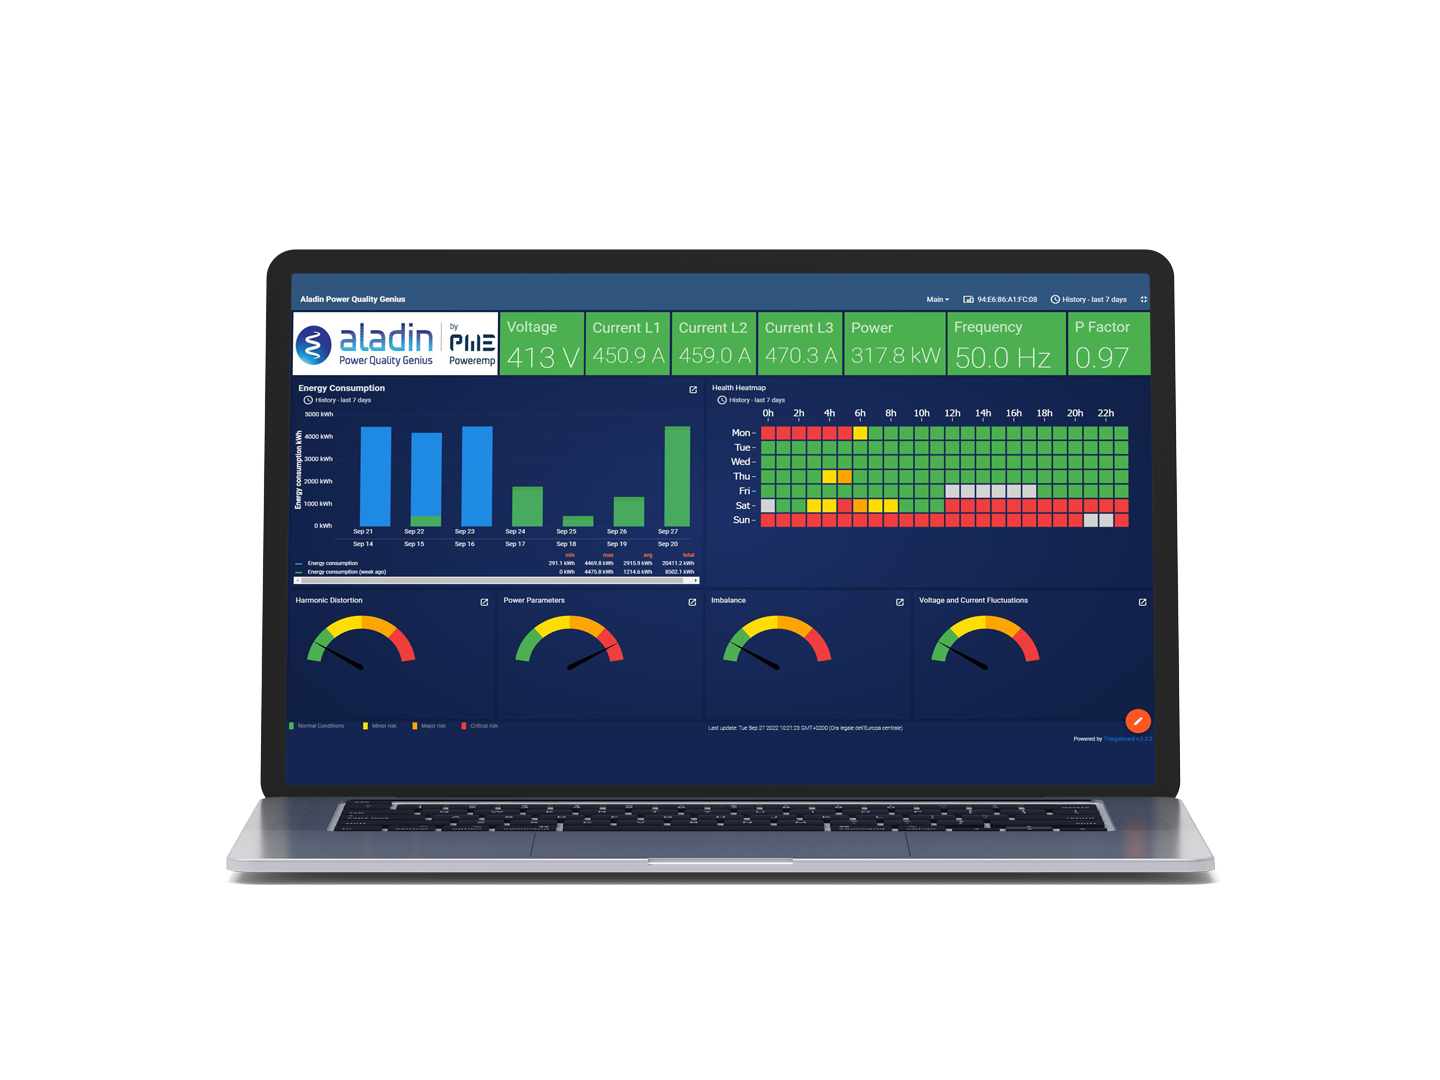
Aladin View
The View application allows visualization and storage of acquired power quality data, intuitive monitoring of the plant’s health status hour by hour, mapping of critical events (transients) and regulatory limit exceedances, and generation of weekly reports for the energy balance and plant health status.
What does Aladin View do?
The Aladin View interface allows:
-
Use of the Cloud dashboard for visualization and storage of acquired data
-
Synoptic plant health status based on color thresholds
-
Hourly plant health status mapping
-
Time trend charts of recorded parameters
-
Generation of weekly reports summarizing energy balance and plant health status
-
Mapping of critical events (transients) and regulatory limit exceedances